A Comparison of Unsupervised Anomaly Detection Algorithms for Time series
Anomaly detection is currently a fairly hot topic in many areas, including SRE, finance, observability, platform engineering, IoT and social infrastructure, the list goes on. Today all the main cloud providers have added some kind of anomaly detection offering to captilise on this trend. AWS have anomaly detection offerings in cloudwatch and SageMaker, etc. Google Cloud Platform are offering it via a ML.DETECT_ANOMALIES ARIMA_PLUS time series model. Mirosoft Azure Machine Learning have an Anomaly Detector based on the Spectral Residual algorithm.
With all the interest in anomaly detection in recent years, there is a lot of hype too. Anomaly detection is often misinterpreted as something that tells you when something is wrong. This is a very common misconception, in reality anomaly detection identifies significant changes. In here lies the rub of anomaly detection, what is significant?
Another misconception and often in the hype, is that there is some perfect formula or algorithm. This is just not true. There is no magic bullet in anomaly detection, there are only varying degrees of insights. This article sets out to provide the reader with a realistic view of the results of various algorithms and what one can expect from anomaly detection. It is not about saying X is good or Y is bad, neither in the sense of the data or the algorithms, it is about demonstrating what anomaly detection can output.
Running a number of the popular state-of-the-art unsupervised algorithms against normal types of application and server/machine metrics it is possible to compare these algorithms in terms of their detection rates.
It is important to state from the outset that this is not a benchmark of any kind. The algorithms have not been specifically tuned, other than some standardisation or transformation of the data where required by the algorithm. Algorithms which have specific hyperparameters have just been set to default or are automatically calculated. Furthermore not all of these algorithms are suited to running in real time on streaming data, they are included to demonstrate detection patterns.
The bag of algorithms being used here are:
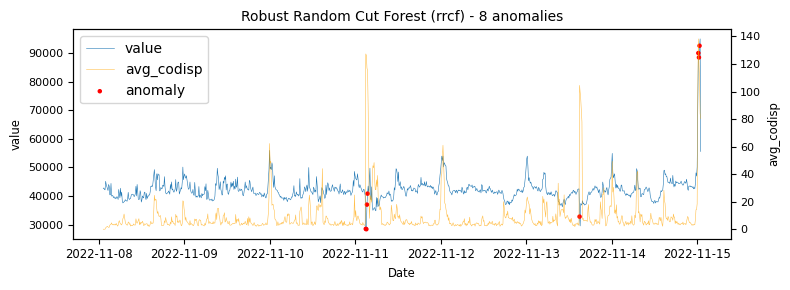
- Robust Random Cut Forest
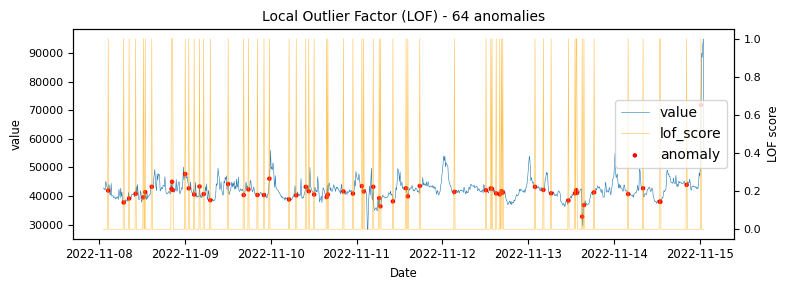
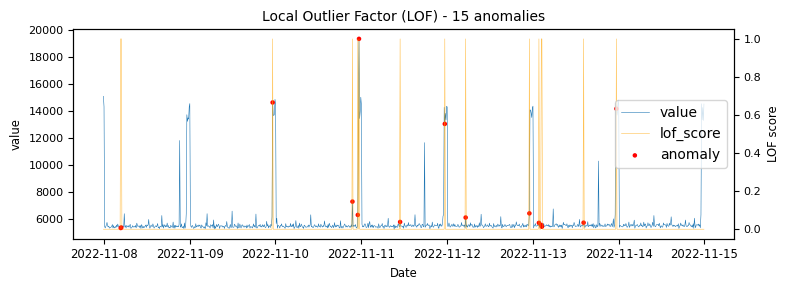
- Local Outlier Factor
- One Class SVM
- DBSCAN (Density-based spatial clustering of applications with noise)
- PCA (Principal Component Analysis)
- Prophet
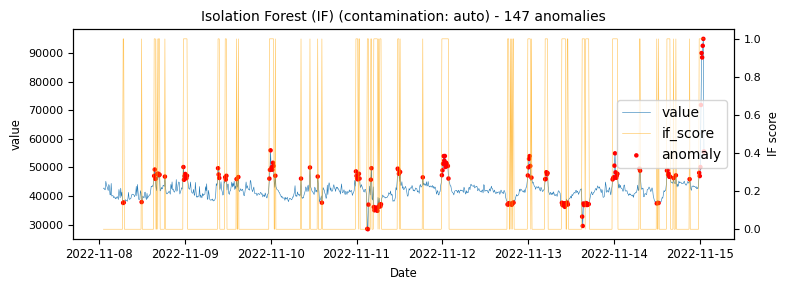
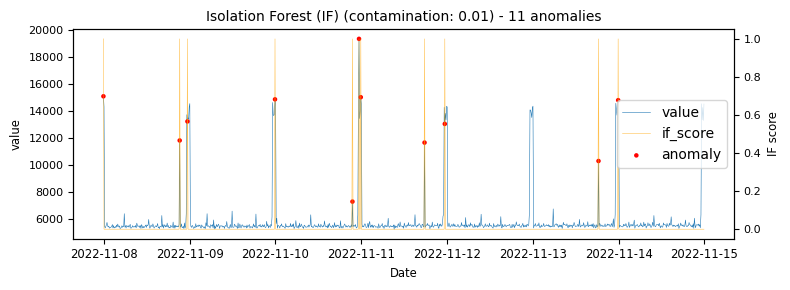
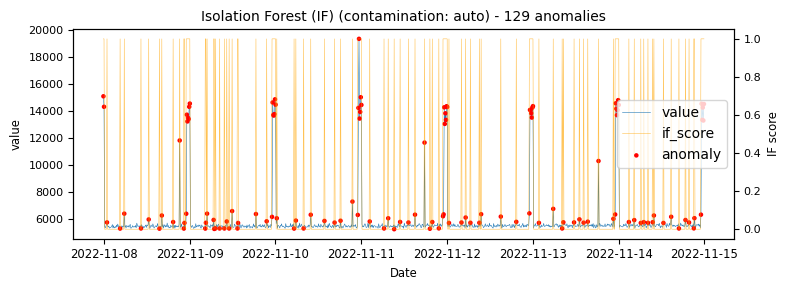
- Isolation Forest (with a contamination setting of auto and 0.01)
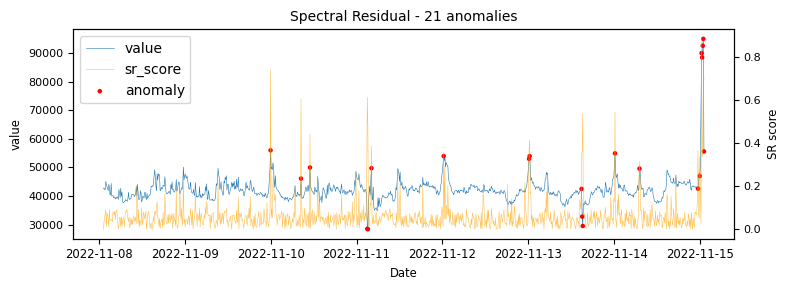
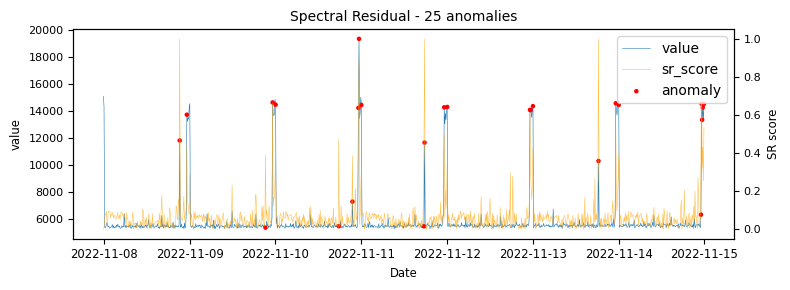
- Spectral Residual
- anomify.ai analysis
These cover a wide range of popular unsupervised algorithms but are in no way exhaustive, there are of course many other state-of-the-art algortihms which are not sampled here, however as with all of them they generate varying results.
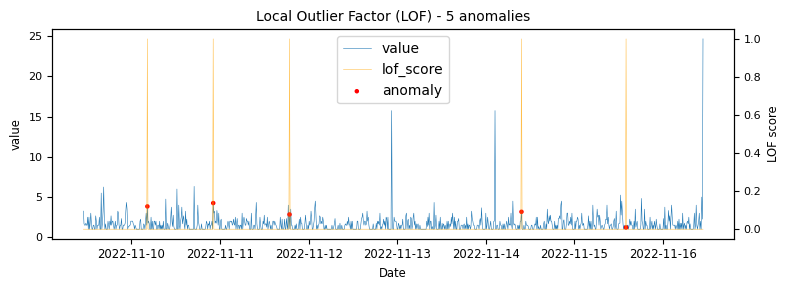
Unstable time-series
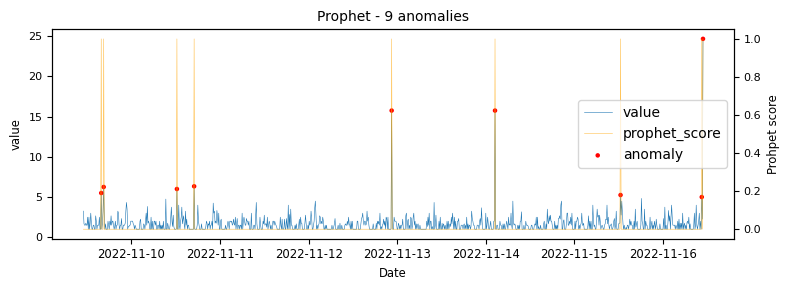
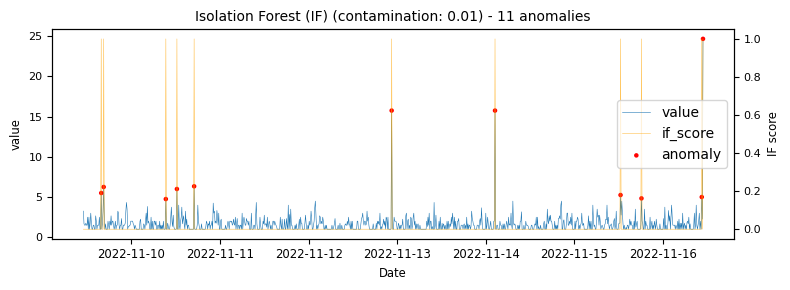
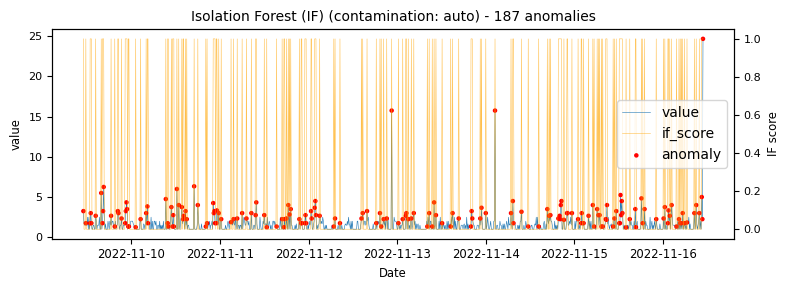
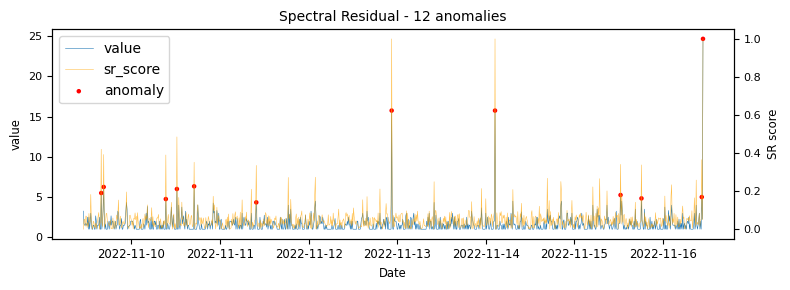
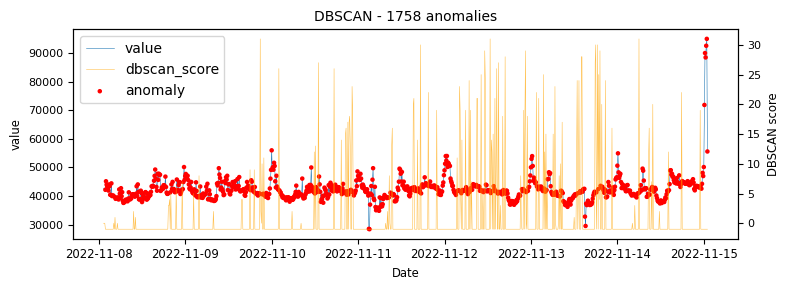
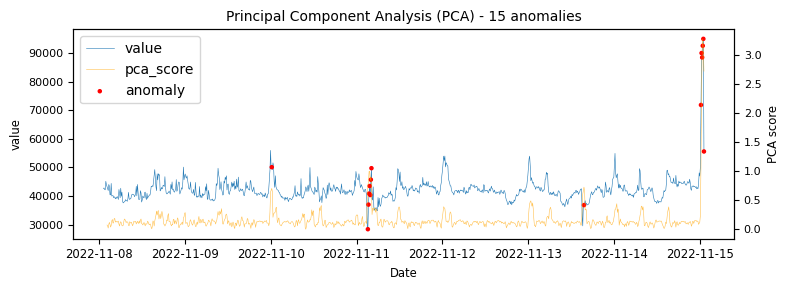
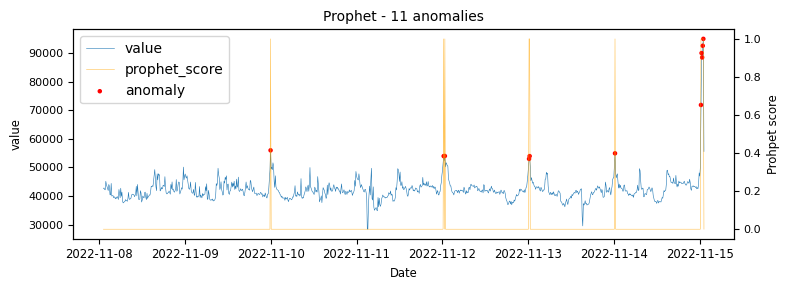
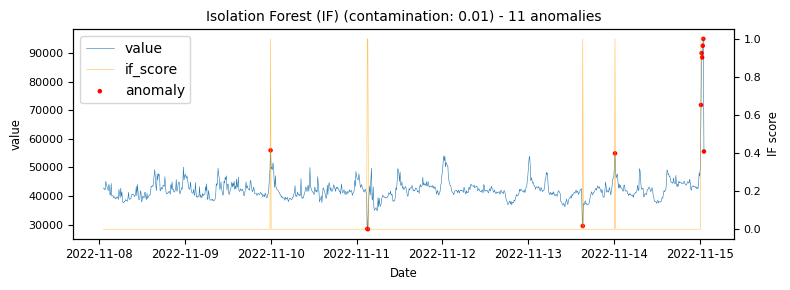
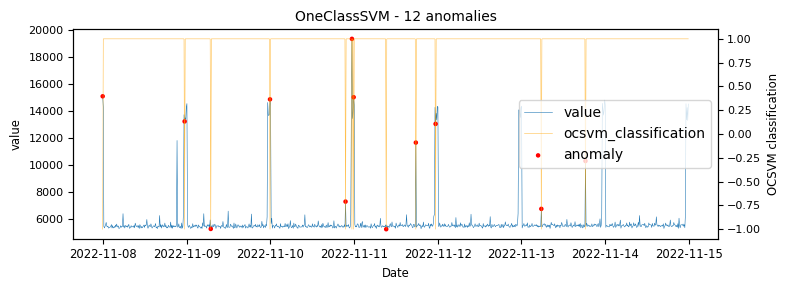
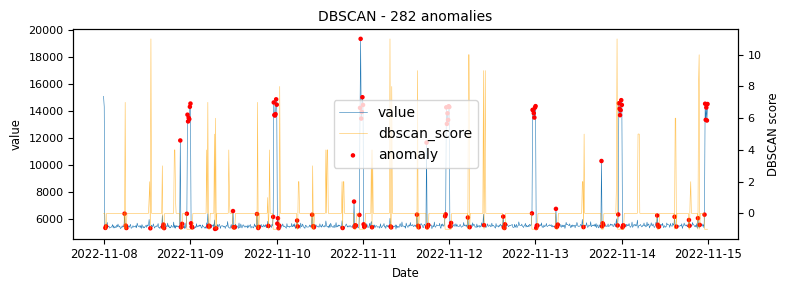
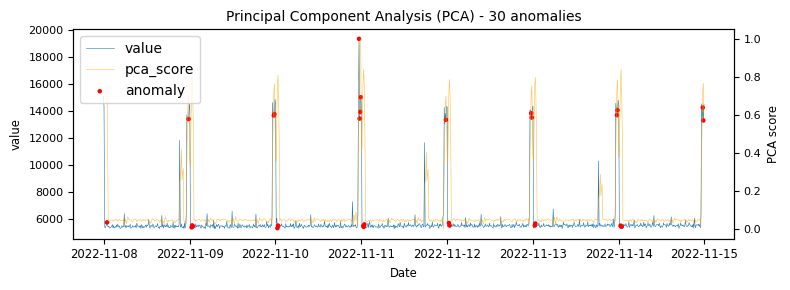
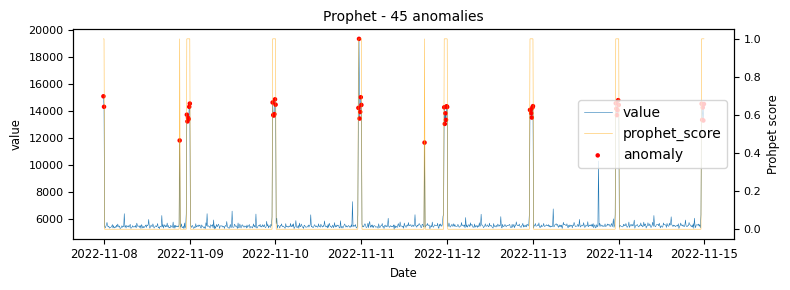
To begin with a time-series which would be classified as an unstable is analysed to demonstrate at what points the various algorithms identify anomalies.
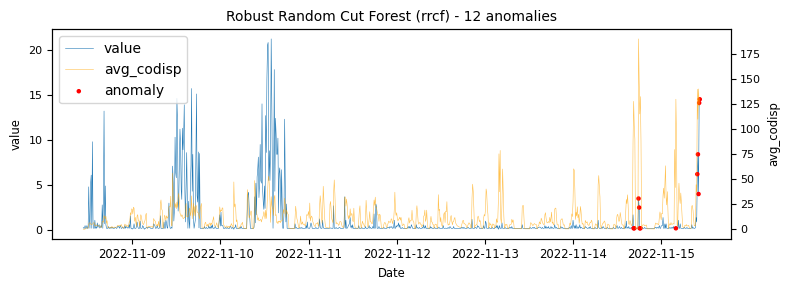
.png)
.png)
.png)
.png)
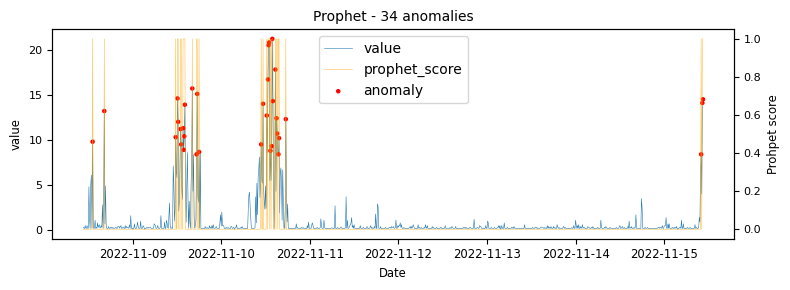
.png)
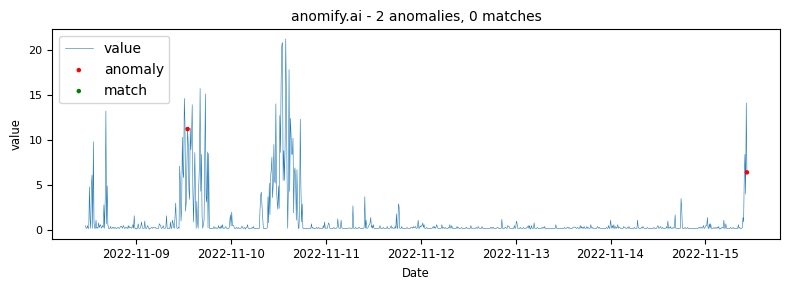
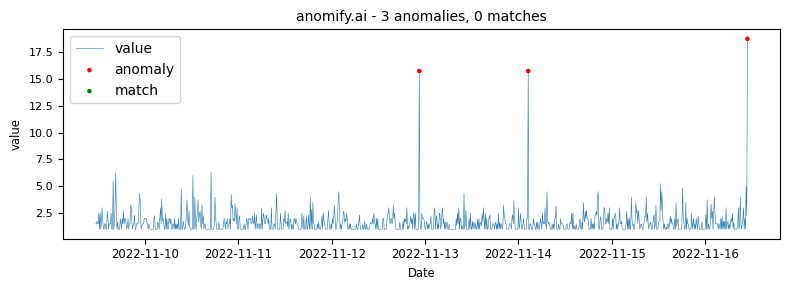
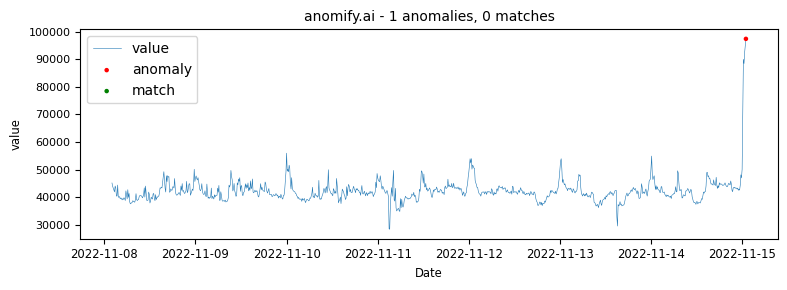
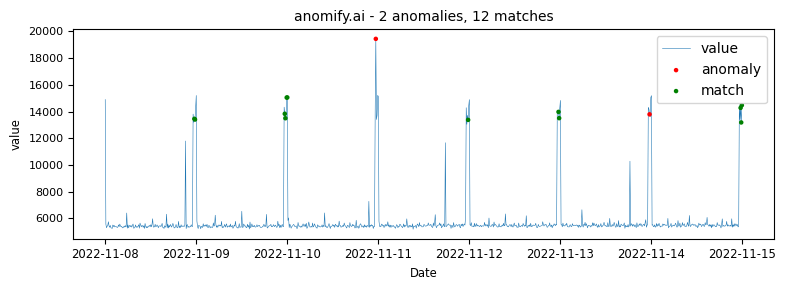
Obviously one of the points of this article is to demonstrate how our analysis compares to other methods. The same data as it was analysed in real time via anomify produced the following results.
Stable time-series
Next the analysis of a time-series which would be classified as an stable.
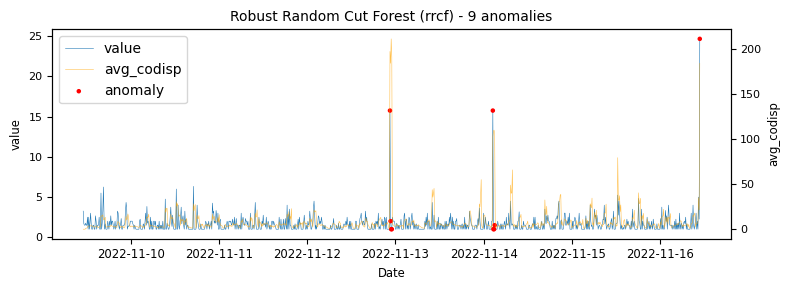
Another stable timeseries
With a bit more volatility.
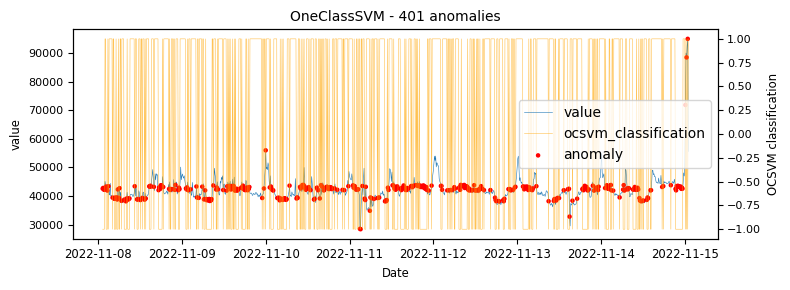
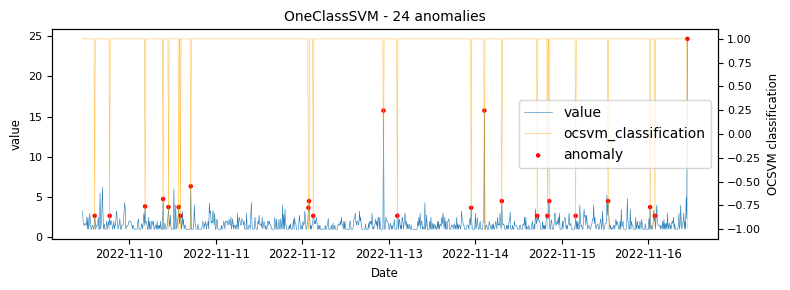
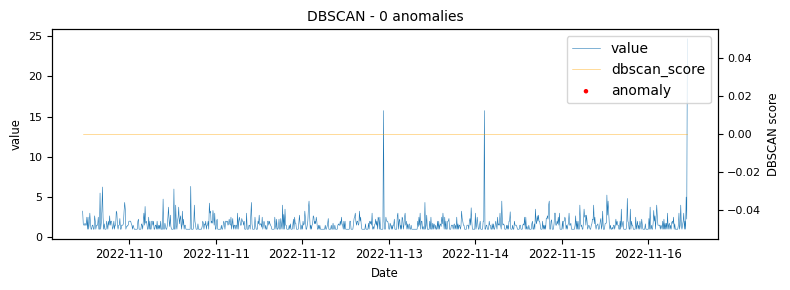
The above illustrations show that both DBSCAN and OneClassSVM algorithms have failed due to the inappropriate default parameters and epsilon value for DBSCAN, which were not suitable for the specific time-series data. This highlights the challenge of using unsupervised algorithms with multiple tunable parameters. Such algorithms may perform well on some data with one set of parameters and poorly on another with the same parameters. Even if efforts are made to automatically determine optimal parameters, the variety of patterns in metrics may result in overfitting or underfitting. This makes unsupervised algorithms especially challenging for detecting patterns in a large metric population.
Seasonal time-series
Next a seasonal time-series is analysed with anomalies (and matches), here we introduce a concept of matching with more on that below.
In the above graph matches can be seen. Matches are instances that were classified as potentially anomalous but then reclassified after having matched very similar patterns in data that the system has been trained on or learnt as normal.
A review of the results
The results demonstrated here make it quite clear that some unsupervised anomaly detection algorithms can generate a fair amount of noise and the results across different algorithms can vary quite dramatically. Most are usually correct in some context, however no single algorithm or method is going to achieve useful insights out the box on all types of data. Although some algortihms do have “silences” built in to them, e.g. only flagging a single instance in X period as anomalous, many do not which can lead to excessive false positives when applied in real world settings.
Unsupervised, supervised, statistical, ML and deep neural network detection methods
Even though unsupervised detection methods are not perfect and on their own in isolation are less than ideal for real world application, they are an absolute requirement in large metric populations and in these settings they are required to have a very high performance. Some of the reasons unsupervised detection is required in this type of setting are:
- It is not feasible to identify and train everything so that supervised detection can be deployed.
- Supervised models drift and need to be updated and validated frequently.
- Supervised methods generally need hyperparameters tuned, often specifically to the type of data.
- Supervised methods and machine learning tend to be expensive in computational time complexity.
- Supervised methods otfen require additional storage for models and incur increased latency when models need to be loaded, updated or created.
Although machine learning and neural networks have gained a lot of attention from the artificial intelligence in recent years and do bring exciting new possibilities to time-series anomaly detection, in the unsupervised arena, statistical methods still generally out perform these methods on point and collective anomaly detection. This is also true in terms of analysis speed, fast training and prediction times.
Getting a pipeline of suitable unsupervised methods is key to making anomaly detection useful and further extending that with additional methods is the next evolution.
Semi-supervised methods
After highlighting the challenges that all unsupervised anomaly detection methods pose, the next part is to look at how semi-supervised methods can come to the rescue. Where false positives are identified as normal and the data is used as training for semi-supervised methods. This is were the concept of matches comes into play and how a little training can result in a massive reduction in false positives.
Gary Wilson