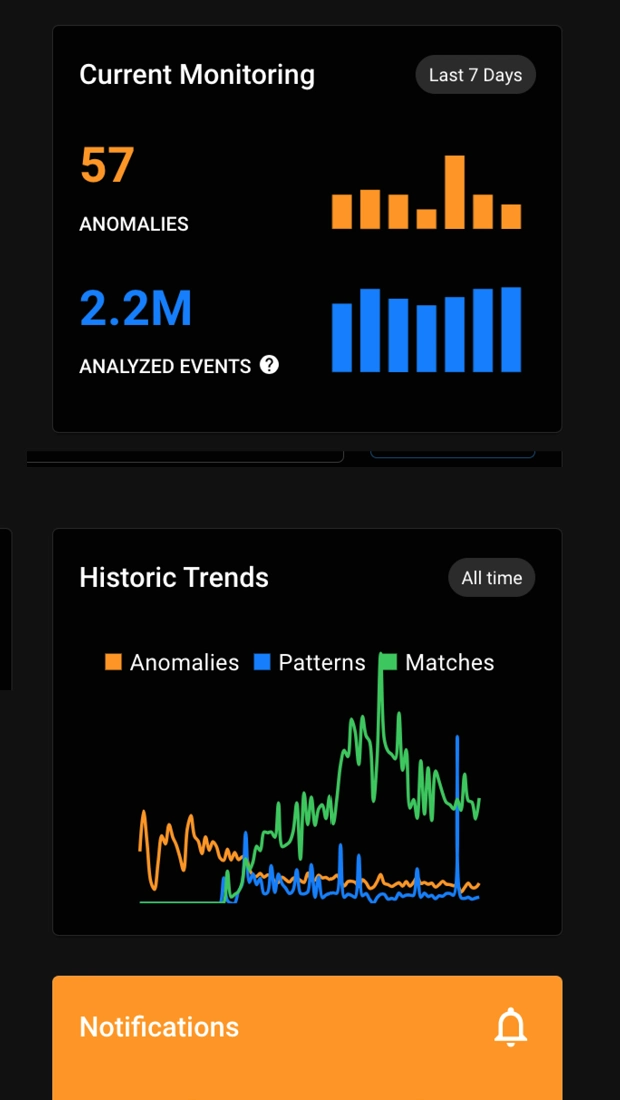
Anomify augments your metric workflow:
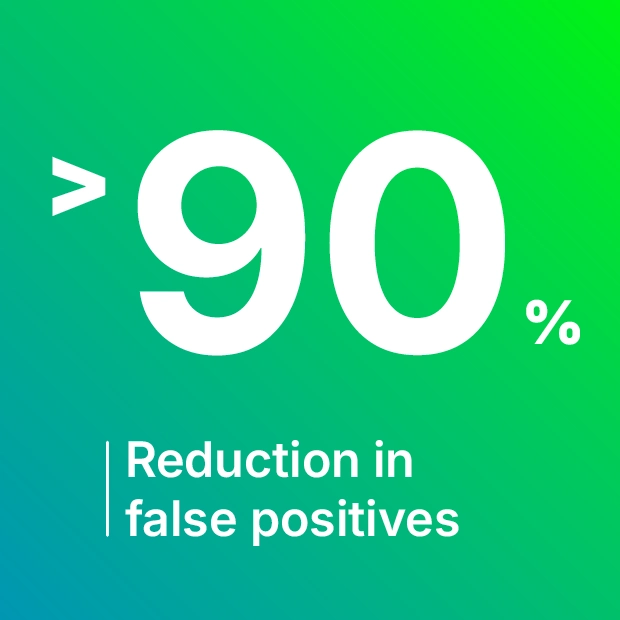
✅ Reduce false positive alerts
✅ Resolve issues quicker
🚀 Find optimisation ideas
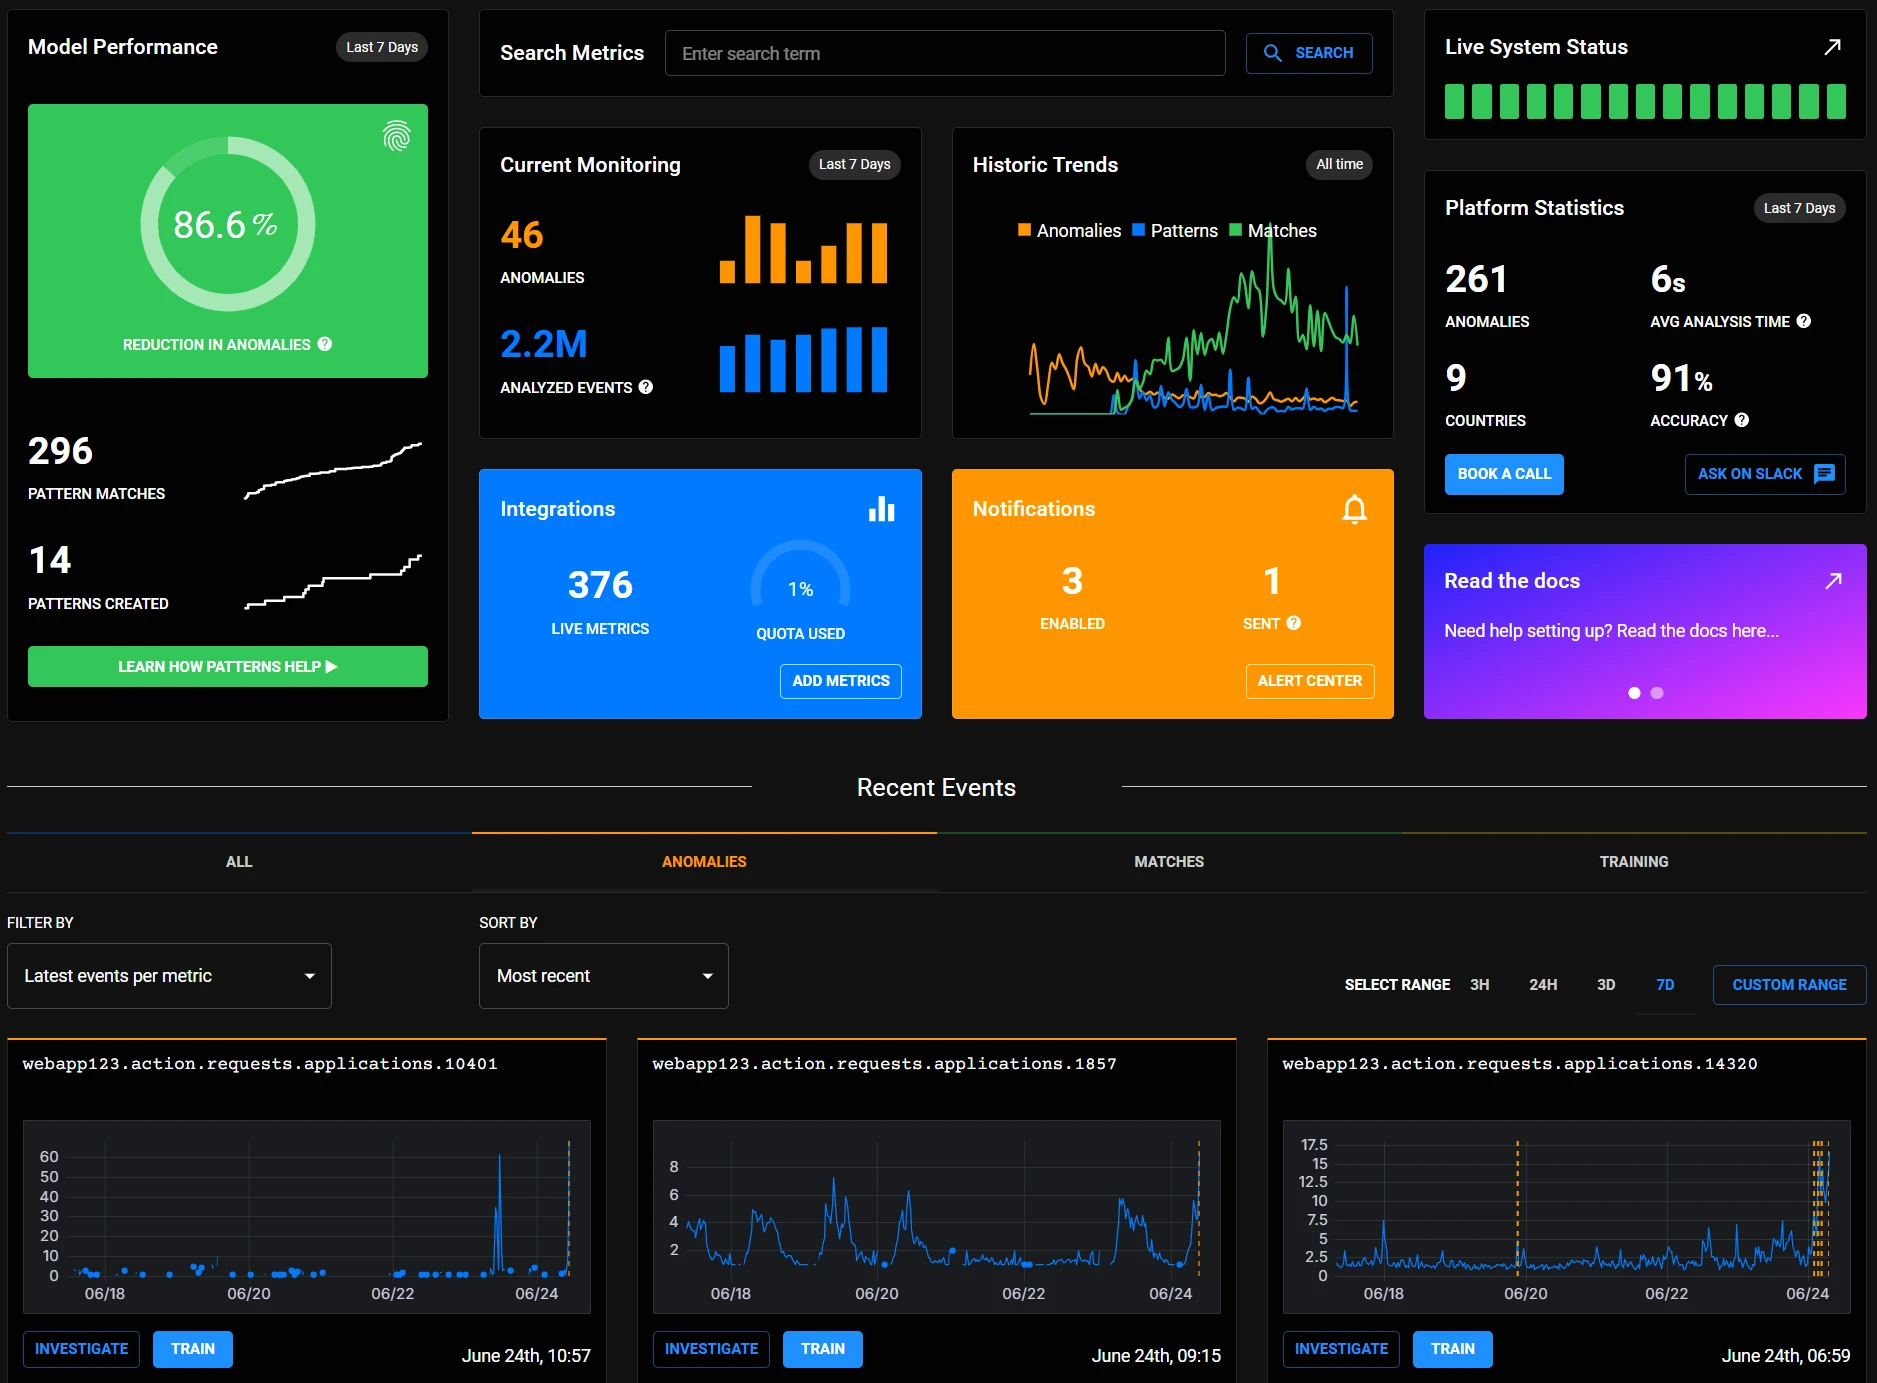
Anomify analyses your metric population every minute. Giving you a snapshot of your system while you’re looking into complex issues.
Find optimisation areas
Speed up root cause analysis
Available without alerts
Train Anomify to fit your data
Anomify is always analysing.
After ingesting data we learn normal patterns, detect any unusual behaviour, alert on anomalies in real-time, and constantly feed back to improve the model.
Anomify acts on a consensus of cutting edge algorithms to determine all types of anomalies.
Add in, best in class Supervised Machine Learning, Pattern Matching, Correlation and Custom Algorithms, and Anomify has your critical events covered.
Anomify gives you peace of mind that the system it's monitoring is performing as you would expect.
Make the most of your error budget. Use Anomify's event notifications to keep downtime to a minimum. Leverage deep event insights for optimization ideas.
Anomify helps companies evolve their devops practices with a platform that helps reduce pager fatigue and streamlines issue resolution.
Send metrics from Wordpress
Send alerts to Microsoft Teams
Send alerts to email
Dispatch alerts to internal tools
Send alerts to Slack
Send traces to Anomify as metrics
Coming soon!
Send metrics to an endpoint
Send Metrics using Telegraf
Send metrics stored in Graphite
Send metrics from Prometheus
Send metrics from Wordpress
Send alerts to Microsoft Teams
Send alerts to email
Dispatch alerts to internal tools
Send alerts to Slack
Send traces to Anomify as metrics
Coming soon!
Send metrics to an endpoint
Send Metrics using Telegraf
Send metrics stored in Graphite
Send metrics from Prometheus
Send metrics from Wordpress
Send alerts to Microsoft Teams
Send alerts to email
Dispatch alerts to internal tools
Send alerts to Slack
Send traces to Anomify as metrics
Coming soon!
Send metrics to an endpoint
Send Metrics using Telegraf
Send metrics stored in Graphite
Send metrics from Prometheus
Send metrics from Wordpress
Coming soon!
Send metrics from Prometheus
Send metrics to an endpoint
Send alerts to Microsoft Teams
Send Metrics using Telegraf
Dispatch alerts to internal tools
Send alerts to Slack
Send metrics stored in Graphite
Send alerts to email
Send traces to Anomify as metrics
Send Metrics using Telegraf
Send alerts to Slack
Send metrics to an endpoint
Send metrics stored in Graphite
Send metrics from Wordpress
Send metrics from Prometheus
Coming soon!
Send traces to Anomify as metrics
Send alerts to email
Send alerts to Microsoft Teams
Dispatch alerts to internal tools
Send alerts to email
Send traces to Anomify as metrics
Coming soon!
Send metrics from Prometheus
Send Metrics using Telegraf
Dispatch alerts to internal tools
Send metrics from Wordpress
Send metrics to an endpoint
Send alerts to Slack
Send metrics stored in Graphite
Send alerts to Microsoft Teams
Using the free account you can send metrics from anywhere to a dedicated endpoint directly via POST request. You can also send metrics directly using Telegraf, the InfluxDB agent, Graphite or Prometheus.
Depending on your service level, a number of plugins and connectors are avilable for common time-series databases and tools like CollectD, StatsD, Google Analytics, Open Telemetry Collector, MySQL, SQL Server.
If we don’t support your datastore yet, please get in touch so we can add it to the roadmap.
Anomify adds an additional dimension to your monitoring/observability set up. Where generally you have rules and thresholds set on things, Anomify monitors all your metrics in the background, keeping an eye on everything.
Rules, thresholds and SLO (Service Level Objective) calculations do not necessarily aid in pinpointing what changed and where – in fact they exclude most metrics. Anomify monitors all metrics and identifies and records abnormal changes, giving you deep insights into your systems and applications when you need it.
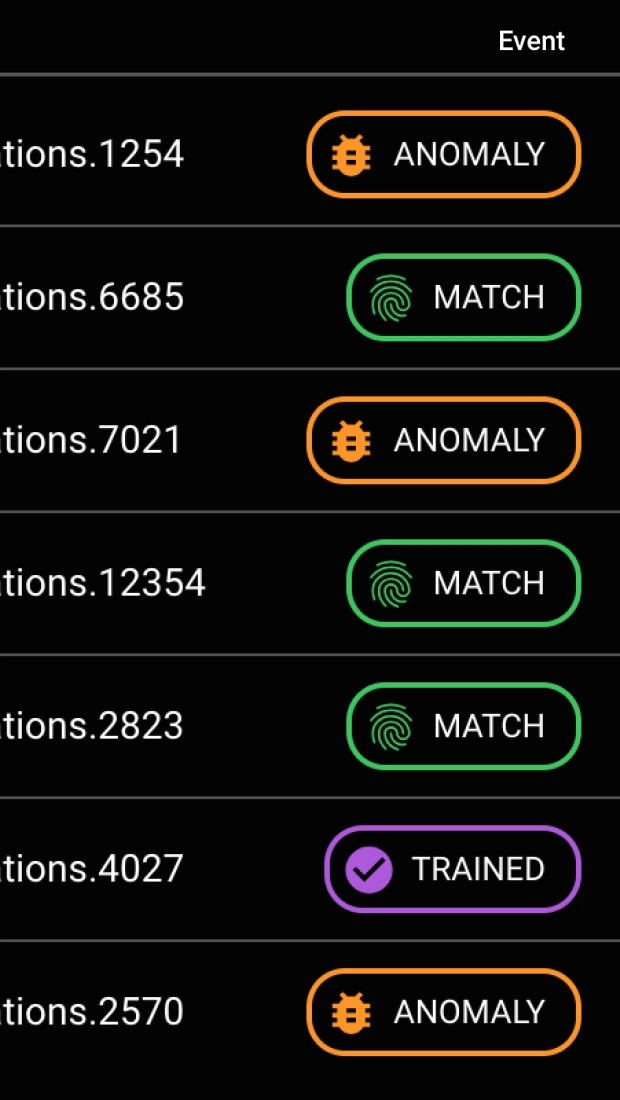
Users in your organisation can train Anomifyto recognise expected patterns, just as they would. This reduces false positive anomalies.
Most anomaly detection platforms use unsupervised learning, which creates a disconnect between the user and the model which makes the anomaly assessment. Anomify’s transparent supervision provides a human explanation for the predictions it makes. Predictions can be amended to fit with your mental model of how the system should behave under normal conditions.
1. Sign up for a free account (2 mins).
2. Send metrics to ingestion endpoint or connect TSDB (30 mins).
3. Sit back and watch as your metrics are continuously analysed for anomalies and correlations.
4. Set up alerts on metrics that matter most.
5. Train the analysis with a click when false positive anomalies occur.
Yes, you can add and remove metrics from the dashboard or via the API.
Each new metric sent to Anomify counts against your metric quota. If you stop sending data against a metric it will continue to count against your quota. However, you may delete metrics and free up space in your quota.
Anomify keeps a record of the number of metrics you’ve sent; it will drop metrics that are sent above your metric quota. You can send metrics with a test header, which bypasses analysis, before committing them to your metric quota.
Yes, please contact hello@anomify.ai
There is no upper limit on metrics. We can scale horizontally to meet your needs.
It depends on the data source we are receiving metrics from. Each source varies in the types of data they support and frequency at which they are stored.
Anomify is not a metric store. For efficiency Anomify preprocesses raw metric data it receives every minute. It stores the processed data for analysis and dumps the raw values.Therefore the metric values recorded by Anomify may not exactly match those recorded in your metric store, but behaviour and trends will be the same.
Anomify stores metric data at a frequency of one data point per minute. How we store data and for how long depends on the data source – it can be anywhere from 30 days with Prometheus/Influxdb/victoriametrics data to as long as 2 years with Graphite and other data sources.
We also store the sections of time-series that have been trained on indefinitely for pattern matching.
Your data will not be shared with any third parties.
After receiving data for ~7 hours, Anomify will have enough data points to get started with analysis and for you to create a few test alerts on a handful of metrics. However realistically you should not consider setting up proper alerts until Anomify has received 7 days of data and has a good picture of expected data ranges.